9. Graphs - Linear
The Cartesian Plane
The Cartesian plane is a two-dimensional coordinate system formed by two perpendicular lines called axes: the x-axis (horizontal) and the y-axis (vertical).
- Origin: The point where the x-axis and y-axis intersect is called the origin, represented by the coordinates (0, 0).
- Quadrants: The plane is divided into four quadrants (I, II, III, IV) by the axes.

The horizontal line is the x-axis and the vertical line is the y-axis.
It’s always good to understand how a Cartesian plane relates to ‘real life’ as it helps when you have to identify its use in a scenario-based exam question.
Imagine the Cartesian plane as a map of your effort vs. reward for different activities.
The horizontal x-axis represents how much reward or satisfaction you get from an activity (positive to the right, negative to the left), and the vertical y-axis represents how much effort or energy the activity requires (positive up, negative down).
For example, a difficult but rewarding activity like studying for an important test would be in the top right (high effort, high reward), while scrolling through social media might be in the bottom left (low effort, low reward).
By plotting your daily activities on this plane, you can visualise whether you're spending your time and energy wisely, identify areas where you might be overexerting yourself with little return, or see where you could potentially gain more reward with minimal effort.
That’s a practical way of using the Cartesian plane, and in summary you can definitely think of a Cartesian plane as a tool for categorising things based on two variables or two options, especially when those variables can be measured or scaled.
We’ve seen the plane, now how about the coordinates?
Points on the Cartesian plane are represented by ordered pairs (x, y), where: The first number, 'x', is the x-coordinate (horizontal position). The second number, 'y', is the y-coordinate (vertical position). For example: The point (3, 2) is located 3 units to the right of the origin and 2 units up.
Let’s do some simple practice questions:
- What are the coordinates of the origin?
- In which quadrant is the point (-2, 3) located?
- What is the x-coordinate of the point (5, -1)?
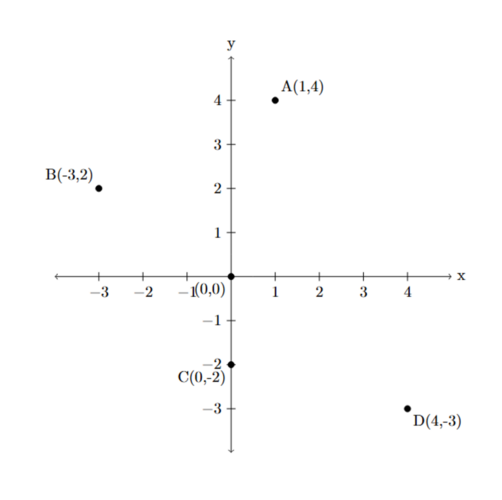
- Plot the following points on a Cartesian plane: A(1, 4), B(-3, 2), C(0, -2), D(4, -3).
- Describe the location of a point with a negative x-coordinate and a positive y-coordinate.
Solutions:
- (0, 0)
- Quadrant II
- 5
- The point is located in the second quadrant (Quadrant II).

Linear Equations
A linear equation can be written in the form y = mx + c, where:
- 'x' and 'y' are variables.
- 'm' is the slope of the line (how steep it is).
- 'c' is the y-intercept (where the line crosses the y-axis).
To plot a linear relationship, you can create a table of values by choosing different values for 'x' and calculating the corresponding values of 'y' using the equation.
Example: For the equation y = 2x + 1:

You can see that from the table of values, you can plot the ordered pairs (x, y) on the Cartesian plane. Then, you’ll be able to draw a straight line through the plotted points. This line represents the linear relationship.
Let’s put in practice what we’ve learned:
- Create a table of values for the equation y = x - 2, using x-values from -2 to 2.
- Plot the points from the table in Question 1 and draw the line representing the equation.
- Create a table of values and graph the equation y = -x + 3.
- What is the y-intercept of the equation y = 4x - 5?
Solutions:


- The y-intercept is -5.


Solving Linear Equations Algebraically
To solve a linear equation, you need to isolate the variable (usually 'x' or 'y') on one side of the equation.
Use inverse operations to "undo" the operations being done to the variable:
- Addition and subtraction are inverse operations.
- Multiplication and division are inverse operations
For example: Solve for x: x + 5 = 8.
- Subtract 5 from both sides: x + 5 - 5 = 8 - 5
- Simplify: x = 3
- Example: Solve for y: 3y = 12
- Divide both sides by 3: 3y / 3 = 12 / 3
- Simplify: y = 4
When solving equations with multiple operations, follow the reverse order of operations (PEMDAS/BODMAS in reverse).
For example: Solve for x: 2x - 4 = 6
- Add 4 to both sides: 2x - 4 + 4 = 6 + 4
- Simplify: 2x = 10
- Divide both sides by 2: 2x / 2 = 10 / 2
- Simplify: x = 5
Let’s do some quick questions (watch the video for the workings):
Solve for a: 4a + 3 = 11 – solution: a = 2
Solve for b: 5b - 9 = 16 – solution: b = 5
Solving Linear Equations Graphically
The solution to a linear equation is the point where the line intersects the x-axis (the x-intercept) if we are solving for x. More generally, to solve an equation graphically, convert it to the form f(x) = 0, then find the x-intercepts of the graph of y=f(x).
How to Find It:
- Graph the equation (as explained in Module 2).
- Identify the x-intercept (where the line crosses the x-axis). The x-coordinate of this point is the solution.
For example: Solve 2x - 4 = 0 graphically. First, rewrite as y = 2x - 4.

You'll see that the line crosses the x-axis at x = 2.
Let’s do a practice question together: Solve 2x - 2 = 0 graphically. We’ll need to change this to 2x – 2 = 0 | 2x = 2 | y = 2x -2. Let’s see this graphed.

The answer is 1, because that’s where x is crossed.
Verifying Solutions by Substitution
After solving an equation algebraically or graphically, you can verify your solution by substituting it back into the original equation.
To do this:
- Replace the variable in the original equation with your solution.
- Simplify both sides of the equation.
- If both sides are equal, your solution is correct.
For example: Verify that x = 4 is a solution to 2x + 1 = 9.
- Substitute x = 4: 2(4) + 1 = 9
- Simplify: 8 + 1 = 9
- Check: 9 = 9 (The solution is correct!)
Let’s do two quick practice questions:
- Verify that x = 6 is a solution to the equation 3x - 5 = 13.
- Is x = 3 a solution to the equation 5x - 7 = 9? Verify your answer.
Solutions:
- 3(6) - 5 = 13; 18 - 5 = 13; 13 = 13 (Correct)
- 5(3) - 7 = 9; 15 - 7 = 9; 8 ≠ 9 (Incorrect)
Solving Problems – Linear Equations
Now, it’s onto the more difficult questions. Let’s take a look at this question:
Question: The Bookstore
A bookstore has two different pricing plans for its online subscription service:
- Plan A: A monthly membership fee of $10 plus $2 per book downloaded.
- Plan B: No membership fee, but each book downloaded costs $4.
The following table shows the total cost for each plan based on the number of books downloaded in a month:

(a) Write a linear equation for each plan in the form y = mx + c, where 'y' represents the total monthly cost and 'x' represents the number of books downloaded.
(b) By plotting both equations on the same graph, determine at what number of books downloaded the total cost for both plans will be the same.
(c) A customer wants to download 8 books in a month. Based on the graphical solution and algebraic verification, which plan should the customer choose to minimise the cost, and what will be the total cost for that plan?
Solution
(a) Plan A: y = 2x + 10 | Plan B: y = 4x
(b) Plot the equations: To plot the equations, you would create a graph with the x-axis representing the number of books downloaded and the y-axis representing the total cost. You would then plot the points from the table for each plan and draw a straight line through them.

From the graph, you can visually see that the two lines intersect where x = 5 and y = 20.
You can also verify this algebraically: Set the two equations equal to each other: 2x + 10 = 4x | Subtract 2x from both sides: 10 = 2x | Divide both sides by 2: x = 5 | Substitute x = 5 into either equation to find y: y = 2(5) + 10 = 20
(c) Find the cost of each plan for 8 books: Plan A (8 books): y = 2(8) + 10 = 16 + 10 = $26 | Plan B (8 books): y = 4(8) = $32
Practice time!
Now, it's your turn to practice.
The questions in this checkpoint are provided to give you an introduction to possible questions you may see in your exam. Don't worry too much as you'll continue to build your skills throughout the course.
Click on the button below and start your practice questions. We recommend doing untimed mode first, and then, when you're ready, do timed mode.
Every question has a suggested solutions videos after you complete the question. This video explains to you the steps to take to answer the question and provides tips and tricks.
Once you're done with the practice questions, move on to the next checkpoint.
Now, let’s get started on your practice questions.
10 questions
Take a Timed Test Take an Untimed Test