16. Chance
In this checkpoint, you’ll discover how everyday terms—like “and,” “or,” and “at least”—translate into the math behind predicting outcomes. You’ll learn complementary events, two-way tables, and Venn diagrams to tackle the more challenging, critical-thinking questions that may appear in exams.
Complementary Events & Sum of Probabilities
What is probability? It's the chance that something may happen, expressed as a number less than 1. For example, the chance that it will rain is 0.5. If the probability is 0, there is no chance. If the probability is 1, it is certain that it has happened or will happen.
For any event A, the complement is “not A.” Since either A happens or it doesn’t, their probabilities sum to 1: P(A) + P(not A)=1.
This means that if an event A has a probability P(A), then the probability of “not A” (the complement of A) is P(not A) = 1 − P(A). For example: If there is a 30% chance of rain, then there is a 70% chance of no rain.
When you have mutually exclusive events (they cannot occur simultaneously), their probabilities add to give the probability of “either one happening.”
The sum of probabilities of all possible, mutually exclusive outcomes is 1.
For two mutually exclusive events A and B, P(A or B) = P(A) + P(B).
For three or more mutually exclusive events, the same logic extends.
Let’s now look at some language:
- “At least k”: means k or more. Example: “at least 3 heads” = 3 heads or 4 heads or 5 heads, etc.
- Exclusive “or” (⊕): A or B but not both.
- Inclusive “or” (∪): A or B or both. Probability formula: P(A∪B) = P(A) + P(B) − P(A ∩ B).
- “And” (∩): A and B both occur.
Let’s do some practice questions now:
- A bag has 5 red counters and 5 blue counters. You pick one counter at random, then return it and pick again (two independent picks). What is the probability that you pick at least one red counter in these two picks?
- In rolling a 6-sided die, let event A = “rolling a 2 or 3” and event B = “rolling a 3 or 4.” (a) Which outcomes satisfy A ⊕ B (exclusive “or”)? (b) Find P(A ⊕ B).
- If P(A) = 0.4, P(B) = 0.5, and P(A ∩ B) = 0.2, find P(A ∪ B).
- A jar contains 3 red marbles, 2 green marbles, and 1 blue marble. Two marbles are drawn without replacement. What is the probability both marbles are red?
- In flipping 3 fair coins (each coin has two sides – a “head” side and a “coin” side that can equally appear), what is the probability of at least 2 heads?
Solutions:
- Probability(at least 1 red) = 1−P (no red at all). P(no red) in one pick = 5⁄10 for blue. Two picks (with replacement) = (5⁄10)2 = ¼. Therefore, 1 - ¼ = 3⁄4
- Event A: {2,3}. Event B: {3,4}. A ⊕ B = outcomes in B but not in both. Intersection: {3} is in both. So A ⊕ B = {2,4}. P(A ⊕ B) = P( {2,4} ) = 1⁄6 + 1⁄6 = 2⁄6 = 1⁄3
- P(A ∪ B) = P(A) + P(B) − P(A ∩ B) = 0.4 + 0.5 − 0.2 = 0.7.
- Probability(first red) = 3⁄6 = ½. After that, 2 red left out of 5 total, so Probability(second red) =2⁄5. Overall probability = ½ x 2⁄5 = 1⁄5 = 0.2
- P(2 heads): (½)3 = 3 [as there are 3 possible 2 item subsets – HHH, HHT, HTH, THH, HTT, THT, TTH, TTT] x 1⁄8 = 3⁄8. From the list, you’ll also see P(3 heads) = 1/8. The sum of this is: 3⁄8 + 1⁄8 = 4⁄8 = 1⁄2
Two-Way Tables and Venn Diagrams
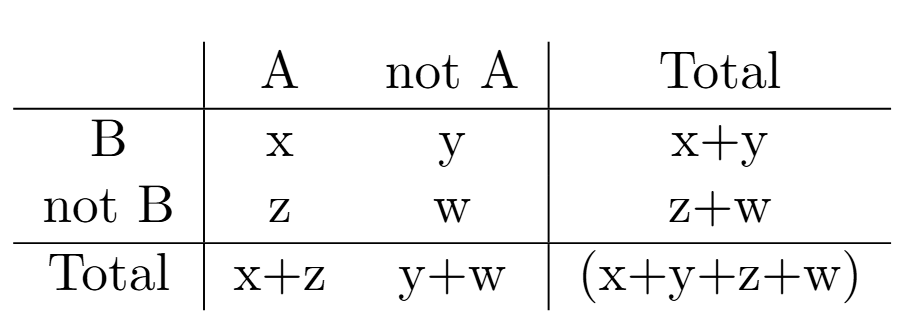
A two-way table categorises outcomes based on two categorical variables. Each cell typically shows frequency or probability. The sums of rows and columns (the “marginal” totals) help find probabilities of combined events.
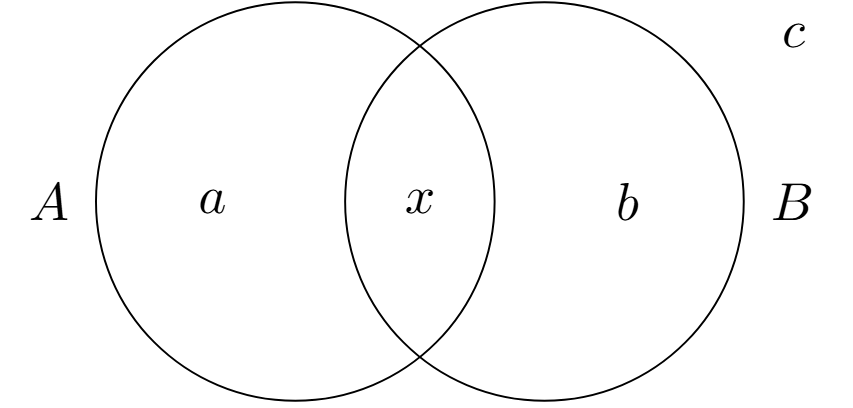
A Venn diagram visually show overlaps between events (like sets A and B). There are three main regions for two sets:
- Inside A only (A∖B – the set of elements that belong to A but do not belong to B – this is shown as a in the diagram), inside B only (B∖A – the set of elements at belong to B but do not belong to A – this is shown as b in the diagram), and inside both A ∩ B (this is shown as x in the diagram).
- The area outside both is the complement of (A ∪ B) – this is noted as c in the diagram.
Let’s do some practice questions now.
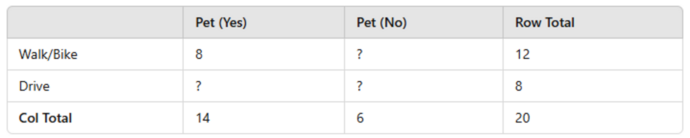
- A class has 20 students. The table below shows whether a student has a pet (Yes/No) and whether they walk/bike to school or get driven. Fill in the missing cells, then find the probability that a randomly chosen student: (a) Walks/Bikes to school and has a pet. (b) Has no pet. (c) Walks/Bikes or drives and has a pet (explain your logic).
- The probability of a randomly selected student from a school being in Grade 8 and studying French is 0.15. Probability(Grade 8) = 0.40. Probability(studying French) = 0.30. Using a two-way table or direct probability logic, find: (a) Probability(Grade 8 or studying French). (b) Probability(not Grade 8 and not studying French).
- Suppose P(A) = 0.5, P(B) = 0.4, and P(A ∩ B)=0.2. (a) Label a Venn diagram with the correct region values. (b) Find P(not(A ∪ B)).
- In a class of 30 students, 18 like soccer (A), 15 like basketball (B), and 10 like both. Fill in the Venn diagram regions with frequencies (numbers of students). Then find how many students like only one of these sports.
- A bag has 5 red counters and 5 blue counters. You draw two counters with replacement and record whether each counter is red (R) or blue (B). Construct a two-way table with the outcomes for each draw, and use it to find: (a) P(RR) (b) P(RB or BR) (c) P(BB)

Solutions:
- 6,4,2. (a) P(Walk/Bike and Pet) = 8⁄20 = 0.4. (b) P(No pet) = 6⁄20 = 0.3. (c) “Walk/Bike or drive and has a pet” is simply “Has a pet,” so 14⁄20 = 0.7. (If the question intended “(Walk/Bike) AND Pet OR (Drive) AND Pet,” that again covers all Pet (Yes) in the table.)
- (a) P(Grade 8 or French) = P(Grade 8) + P(French) − P(Grade 8 and French) = 0.40 + 0.30 − 0.15 = 0.55. (b) “Not Grade 8 and not French” = 1 − P(Grade 8 or French) = 1 − 0.55 = 0.45.
- (a) A ∩ B = 0.2. A∖B = 0.5 − 0.2 = 0.3. B∖A = 0.4 − 0.2 = 0.2. (b) P(not(A ∪ B)) = 1 − P(A ∪ B) = 1 − (0.5 + 0.4 − 0.2) = 1 − 0.7 = 0.3.
- Let the intersection (both) = 10. Only soccer = 18 – 10 = 8. Only basketball = 15 – 10 = 5. Outside both = 30 − (8 + 10 + 5) = 7. Students who like only one = 8 + 5 = 13.
- See video for table. Possible first-draw outcomes: R or B. Similarly for second draw. With replacement, each pick is independent. (a) P(RR) = 0.5 × 0.5 = 0.25. (b) P(RB or BR) = 0.5 × 0.5 + 0.5 × 0.5 = 0.25 + 0.25 = 0.5. (c) P(BB) = 0.5 × 0.5 = 0.25
Multi-Part Question
Now that we’ve looked at the concepts, lets do a multi-part question that combines many of the concepts in this checkpoint and some from other checkpoints.
Question 1: Beverage Preferences
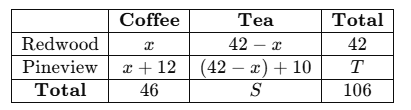
Two neighbourhoods, Redwood and Pineview, ran a survey about beverage choices. Each participant chose either coffee or tea. Some partial results are recorded in the two-way table below:
a. A participant from Redwood is chosen at random. What is the probability (in simplest fraction form) that they prefer coffee? Express your answer first in terms of x and then evaluate it using your found value of x.
b. A participant from the entire survey of 106 people is chosen at random. Write (and then simplify) the probability that this participant is from Pineview and prefers tea.
c. A participant from the group of tea drinkers is chosen at random. What is the probability that they are from Redwood? Give your final answer as a fraction in simplest form.
Solutions:
Watch the video for full workings. Using algebra, you’ll find x = 17 which will then allow you to fill out the rest of the table. But you shouldn’t yet, as that will take a lot of time. Let’s answer the question first.
(a) P(Coffee | Redwood) = 17/42 This is the answer in fractional form.
(b) P(Pineview | Tea) = 35/106 – this cannot be simplified further so remains as is
(c) P (Redwood | Tea) 25/60 = 5/12
Question 2: Sport Preferences
A PE teacher surveys 60 students about whether they like soccer (S) or netball (N). Each student can like neither, one, or both sports. The results are shown in the partially labeled Venn diagram below:
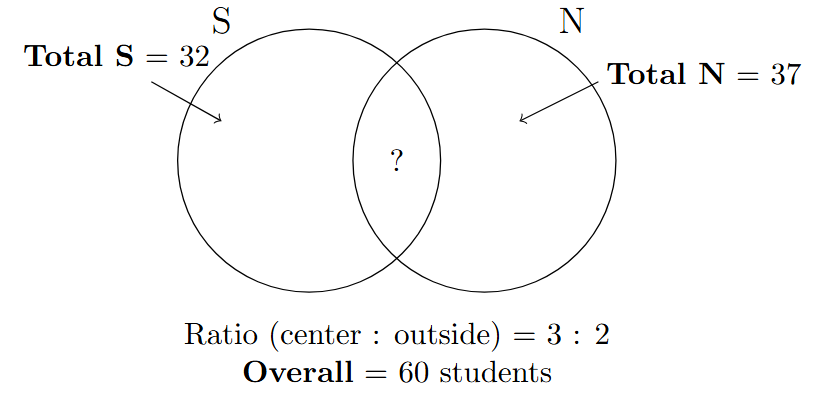
The teacher is then provided with further information that the number of students who like both soccer and netball is 10 less than the number of students who like netball.
A student is chosen at random from the 60 students. If the student does not like netball, what is the probability that they like soccer? Express your answer as a fraction in simplest form.
Solutions
To solve the modified question about sport preferences, we start by interpreting the given Venn diagram for a survey of 60 students on whether they like soccer (S) or netball (N). The total who like soccer is 32, the total who like netball is 37, and the overall total is 60. We are told that the number of students who like both soccer and netball is 10 less than the total number of students who like netball, which is 37, so the number who like both is 37 - 10 = 27. Let’s define the Venn diagram regions: the number who like both is 27, the number who like soccer only is 32 - 27 = 5, the number who like netball only is 37 - 27 = 10, and the number who like neither is found by subtracting the others from the total, so 60 - (5 + 10 + 27) = 60 - 42 = 18. To verify, the total is 5 + 10 + 27 + 18 = 60, which matches, and the totals for soccer (5 + 27 = 32) and netball (10 + 27 = 37) also match. Now, we need the probability that a randomly chosen student who does not like netball likes soccer. First, find the number of students who do not like netball: the total who like netball is 37, so those who do not like netball are 60 - 37 = 23. This group includes the soccer only (5) and neither (18) regions, confirming 5 + 18 = 23. Among these 23 students, those who like soccer are the soccer only group, which is 5 students. Thus, the probability is the number who like soccer and do not like netball divided by the total who do not like netball, which is 5 / 23. Since 5 and 23 have no common factors, the fraction 5/23 is already in simplest form. Therefore, the probability that a student who does not like netball likes soccer is 5/23.
Practice time!
Now, it's your turn to practice.
The questions in this checkpoint are provided to give you an introduction to possible questions you may see in your exam. Don't worry too much as you'll continue to build your skills throughout the course.
Click on the button below and start your practice questions. We recommend doing untimed mode first, and then, when you're ready, do timed mode.
Every question has a suggested solutions videos after you complete the question. This video explains to you the steps to take to answer the question and provides tips and tricks.
Once you're done with the practice questions, move on to the next checkpoint.
Now, let’s get started on your practice questions.
10 questions
Take a Timed Test Take an Untimed Test