17. Data
The Basics of Data
Let’s learn about the basic concepts in data:
- Population: This is the entire set of items or individuals we are interested in studying. For example: all Year 8 students in your school, all the fish in a lake, every product made in a factory. A census involves collecting data from every member of the population (which can be time-consuming and expensive).
- Sample: A smaller group selected from the population. We use it to draw conclusions or make estimates about the whole population. It’s important that the sample be representative: it should reflect the main characteristics of the population (e.g., if the population is 50% boys and 50% girls, a representative sample tries to have roughly the same ratio). A sample can be used as it is more practical that surveying the entire population.
For example, you want to check for quality and have 500 pieces of fruit in a warehouse. You randomly select 20 pieces and find that 3 of them are bruised. What is the sample? It’s 20. If you use this sample’s result, what is the estimated number of bruised fruit in the entire 500? 3 out of 20 is 15% so 15% of 500 piece is 75. It suggests that potentially, 75 pieces of fruit could be bruised.
However, this is an estimation. The cause of the bruising could be localised and could be much less or more. The sample may not always represent the population appropriately and as such, results can vary. However, it’s a good way to make inferences based on data.
Let’s now learn how to work with data and what the data could be telling us.
Range, Mean, Median, Variation & Outliers
Here are some concepts to know when looking at data:
- Mean: The sum of all data values divided by the number of data values. It represents an “average” for that sample. This figure is sensitive to outliers (see next dot point) because an extremely large (or small) value can pull the average up or down significantly.
- Outliers: A data value that is much larger or smaller than most of the other values. Can happen by chance or because of data entry mistakes. Important to identify and decide whether to keep them, remove them, or investigate further.
- Median: The middle value when the data is arranged from smallest to largest. If there’s an even number of data points, the median is the average of the two middle values. It’s less sensitive to outliers because it only depends on the middle position(s).
- Range: The difference between the largest and smallest values in a data set. Affected strongly by extreme values (outliers).
- Proportion in a Sample: If you are focusing on a particular category (e.g., “High Allowance” of $12 or more), the proportion is the fraction or percentage of sample items that fit that category. Proportion = Number of items in the category divided by Total items in the sample
- Variation in Samples: Even if two different groups (samples) come from the same population, their means or proportions can differ because of chance. Generally, larger samples give more stable (less variable) estimates of the true population mean or proportion. By looking at several samples, we can see how the mean or proportion changes. If we pick samples randomly, we can expect the sample mean to be “close” to the true population mean, especially if the sample is large.
Let’s have a look at these concepts visually:
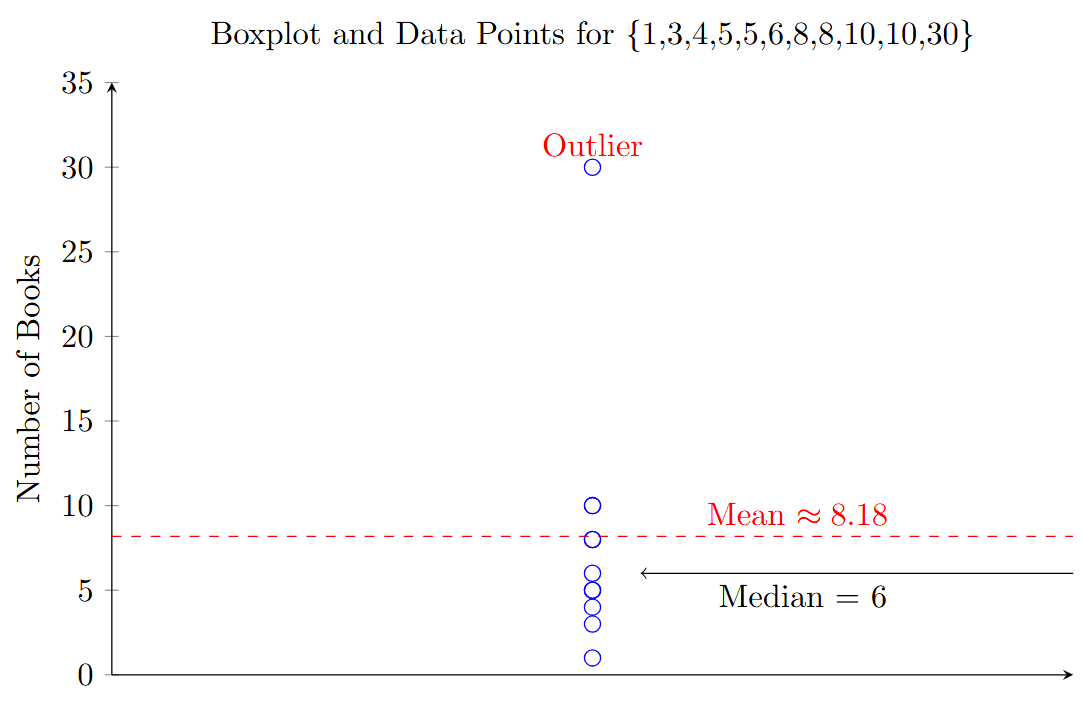
When tackling statistics or data-based questions in competitive exams, it’s important to keep both the big picture and the finer details in mind. First, look at the overall trend of the data—identify any broad patterns, typical ranges, and possible outliers. This big-picture perspective helps you quickly spot any potential anomalies or overarching relationships, which can guide your reasoning.
Once you have established a general understanding, zoom in on the specifics: carefully examine exact values, calculate relevant measures (like mean, median, range), and check how outliers might be influencing the results. By starting with a high-level scan and then diving deeper into detailed calculations, you can avoid getting lost in a sea of numbers and ensure that your conclusions are both accurate and comprehensive.
Multi-Part Questions
Question 1: Tea Temperature
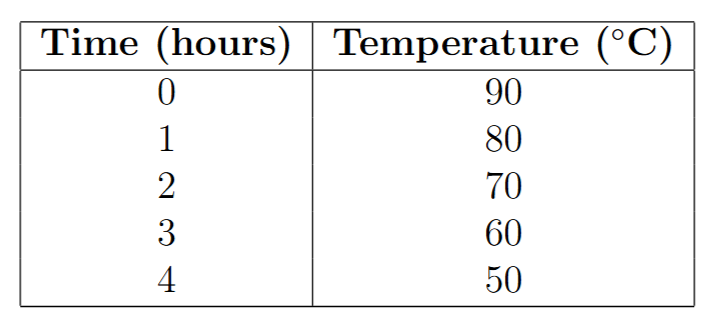
A café manager records the temperature of a pot of tea over several hours (time measured from when the tea was first brewed). The data is shown below:
Which of the following equations would be the correct expression to help you find what time the tea would reach 55°C?
a. 90 – 10t = 60
b. 90 = 5t + 55
c. 145 - 5t = 110
d. (90 – 55) / 10 = t
Solution
The table shows the temperature decreasing linearly: at t=0 hours, T=90°C; at t=1, T=80°C; at t=2, T=70°C; at t=3, T=60°C; and at t=4, T=50°C. The temperature drops by 10°C per hour, so the rate of change is -10°C/hour. Using the slope-intercept form T = mt + b, the slope m is -10, and at t=0, T=90, so b=90. Thus, the equation is T = -10t + 90. To find the time when T=55°C, set up the equation: 55 = -10t + 90. Subtract 90 from both sides: 55 - 90 = -10t, which simplifies to -35 = -10t. Divide both sides by -10: t = -35 / -10 = 3.5. Therefore, the tea reaches 55°C at t=3.5 hours, and the correct equation to solve this is 90 - 10t = 55, matching option D in its modified form of (90 - 55) / 10 = t (a re-arrangement of the original formula)
Question 2: The Business of Running a Café’
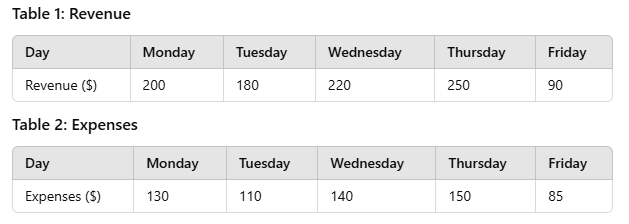
A small café tracks its daily Revenue and Expenses (in $) for one workweek (Monday–Friday). The tables below show the data:
Which of the following pairs (Mean Daily Profit, Median Daily Profit) is correct?
a. ($70, $70)
b. ($65, $70)
c. ($70, $65)
d. ($65, $60)
Solution
B is the correct answer.
- Monday: Revenue = 200, Expenses = 130 → Profit = 70
- Tuesday: Revenue = 180, Expenses = 110 → Profit = 70
- Wednesday: Revenue = 220, Expenses = 140 → Profit = 80
- Thursday: Revenue = 250, Expenses = 150 → Profit = 100
- Friday: Revenue = 90, Expenses = 85 → Profit = 5
To get the mean: sum the profits = 70+70+80+100+5=325. Then divide by the number of days: 5. 325 / 5 = 65. To find the median: Sort the daily profits: {5,70,70,80,100}. The middle value (3rd in the sorted list) is 70.
Question 3: Furniture Store Floor Plan
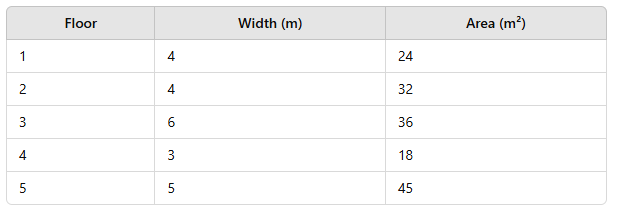
A furniture store is measuring 5 rectangular display floors for a renovation project. The following table shows each floor’s width and area (in square meters):
Which fraction represents the proportion of floors that have length greater than 6 m?
a. 1⁄5
b. 2⁄5
c. 3⁄5
d. 4⁄5
Solution
Calculate the length of each floor = area / width. This is 6, 8, 6, 6, 9. As 8 and 9 are greater than 6, the proportion is 2/5.
Practice time!
Now, it's your turn to practice.
The questions in this checkpoint are provided to give you an introduction to possible questions you may see in your exam. Don't worry too much as you'll continue to build your skills throughout the course.
Click on the button below and start your practice questions. We recommend doing untimed mode first, and then, when you're ready, do timed mode.
Every question has a suggested solutions videos after you complete the question. This video explains to you the steps to take to answer the question and provides tips and tricks.
Once you're done with the practice questions, move on to the next checkpoint.
Now, let’s get started on your practice questions.
10 questions
Take a Timed Test Take an Untimed Test